Unlocking Research Insights by Integrating Data Through Standard Vocabularies with a Powerful Analytics Interface

Ability to re-use and integrate research data across research studies (with appropriate consents) has the potential to unlock innovative and actionable insights.
The TrialX xPand system enables collection of diverse types of data including surveys with text input, single/multiple text choice input, scale type questions, geo location, images, video and audio, streaming data from device/phone sensors such as step counts, heart rate, breathing rate record activity and so on. The data is modeled as a denormalized data store in the backend with Entity-Attribute-Value (EAV) format thereby providing an extensible way to store the data.
As our customers leverage the TrialX xPand solution to collect research data across different research studies and across multiple organizations, the need to semantically integrate and analyze research data has emerged as one of the key challenges. Semantically integrating data across research studies requires coding the data fields with standardized vocabularies and using data dictionaries for meta-data fields collected as part of the research study.
What did we develop?
The Vocabify App
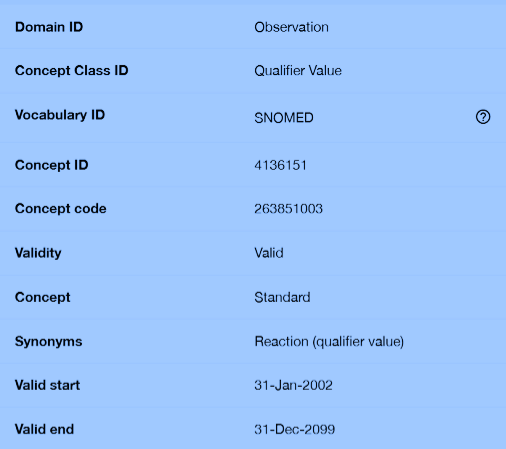
One of core features of the Andromeda release of xPand includes a module called “Vocabify” that enables research teams to integrate and analyze data from various kinds of studies. Vocabify app consists of different models to standardize study specific data from different research studies in the database. It would contain a collection of names, definitions and attributes about data elements that are being used or captured in a database, serving the purpose of a data dictionary.
The vocabify module can also export the data into a standard database such as OMOP (Observational Medical Outcomes Partnership) which allows systematic analysis of data and also can be used to transform observational health data to a common format.
Analytics Dashboard
Analytics platform allows users to decipher their raw data through graphs and charts. Users can perform in-depth data analysis, which improves productivity in decision making and innovation by delivering comprehensive insights. The visualization plug-in architecture in the xPand analytics dashboard makes it easy to build a wide array of useful custom visualizations. It provides authentication, user management, permissions and roles. All the data is controlled through granular access control – maintaining control from macro to micro level securities. Users can also create new dashboards to get insights for various kinds of data. They can also add preloaded custom charts to the dashboard by searching charts relevant to their data. The analytics platform makes it easy and fast for users to create and share dashboards.
xPAND Analytics Dashboard
A couple of other significant features were also introduced as part of this release to help research study teams to streamline research operations and data collection process.
Single Sign On: xPand consists of multiple independent systems like No-Code web builder for rapid development of research mobile applications, an xPand Upload System for research data upload and an analytics platform for reports and insights about data collected. Each of these systems had separate logins. In this release, we came up with a solution of single sign-on for xPand web and xPand Analytics systems making it easy for the users to move across systems seamlessly without using different sets of credentials for different systems. The xPand web builder allows users to collect data through apps and the analytics platform allows users to view data and insights through graphs and charts.
Offline Data Collection and Event Tracking: With new enhancements, the xPand system now allows the app users to submit study surveys and active tasks offline (without any internet connectivity). We store that data locally and show users the alert message to turn on their mobile internet until the data is synced to the server. Without these pop-up alerts, users were still able to submit data offline, however the user didn’t know if the data got posted successfully after the internet connection was restored.
In addition, the system now allows research teams to track or capture user activity happening within an app – such as screen swipes and button clicks along with the local/ UTC time-stamps thus giving an understanding of user journey in the mobile app.
Andromeda isn’t just about tracking and capturing user activities but a total package of building custom visualizations by integrating collected data through an analytics platform. We are very excited about the possibilities that Andromeda release brings to our customers. Stay tuned for more exciting features coming up in our future releases.
#MobileClin2022 Tech Demo Presentation
We are gearing up to demo how we are enabling decentralized clinical research in commercial space missions at the Mobile Tech in Clinical Trials 2022 conference on September 12, 2022. Our CEO Dr. Sharib Khan will share how technologies used in space health research are providing a blueprint for decentralized clinical trials on earth and demonstrate how the TrialX xPAND platform used by the Translational Research Institute for Space Health (TRISH) is pushing the envelope of research. We look forward to seeing you at the live tech demo session at 12:10 PM on September 12, 2022. If you would like to learn more about xPAND or schedule a meeting with Dr. Khan during the conference, get in touch.
Here’s our scheduling link if you would like to avoid the back and forth of finding a time to meet Dr. Khan calendly.com/trialx
With contributions from Fajer Naqeeb, Gufran Syed, Wahdat Jan, Tabinda Bhat, Jayanta Mistry, Mir Suhail and Chintan Patel.


